Research
I structured and led a series of internal and customer sessions using real enterprise-scale pipelines. These observations showed a consistent pattern. Users rarely tried to understand the entire graph at once. Instead, they worked within localized “neighborhoods,” centering a cluster of related nodes, completing work in that area, then moving on.
One of the more surprising findings was that showing less information actually improved comprehension. When surrounding noise was reduced, users were quicker to understand how data flowed and what would be affected by a change.
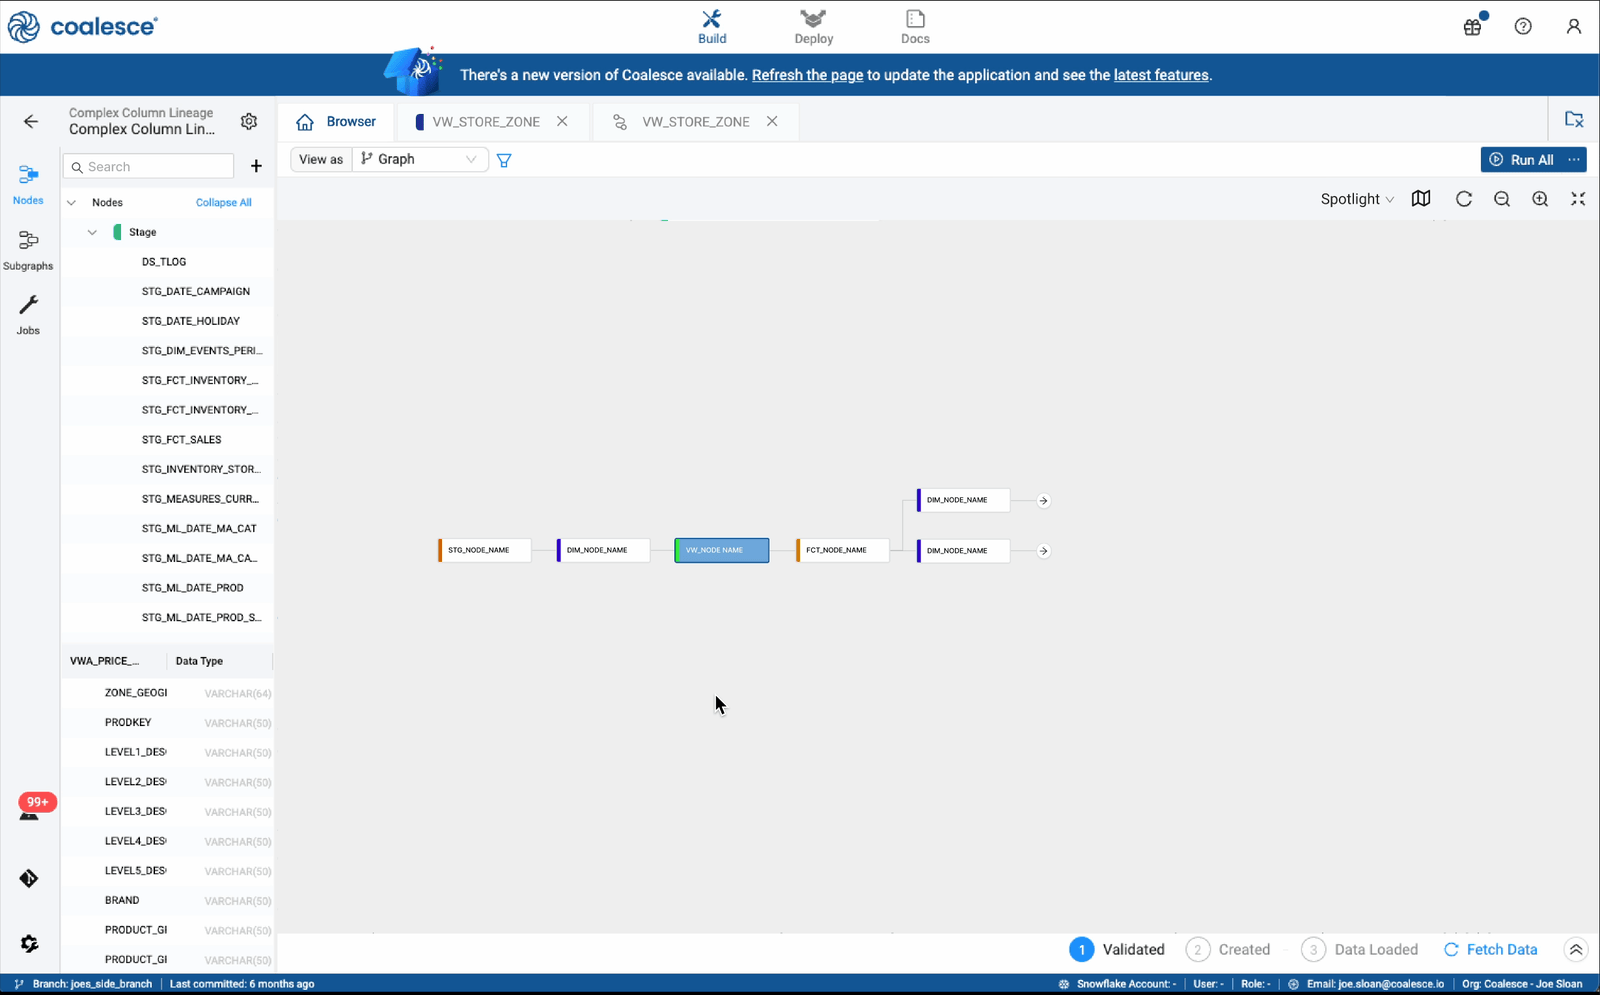
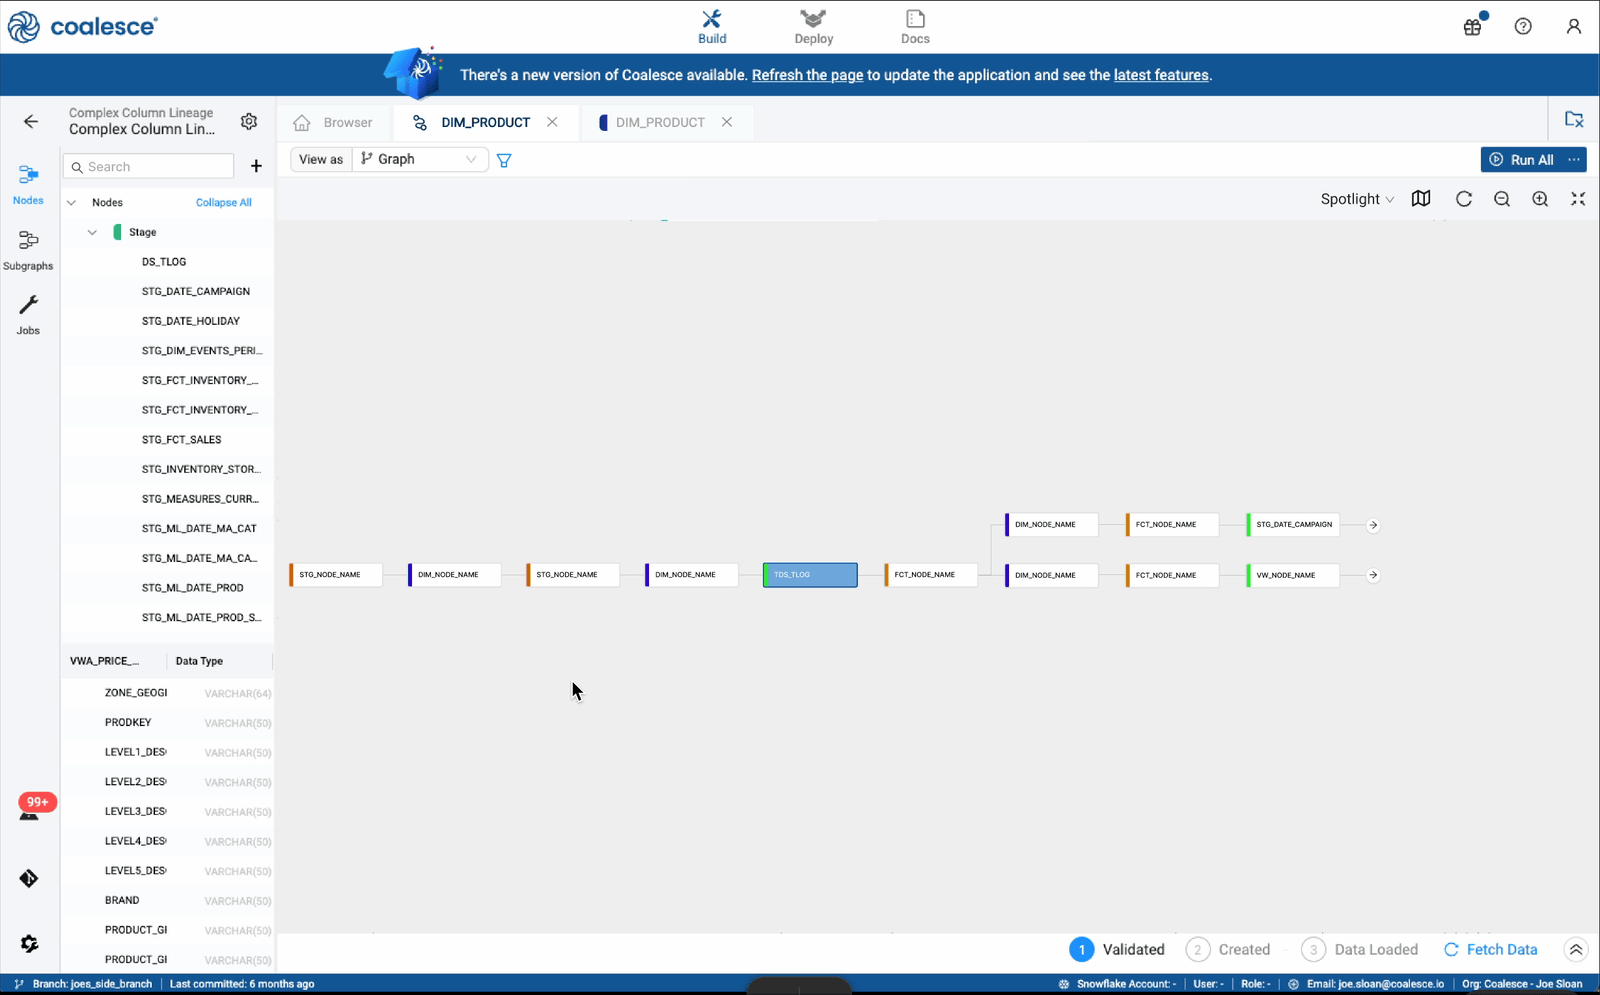
We explored several focused viewing approaches that surfaced only the most relevant portion of the graph.

To avoid trapping users in rigid boundaries, I introduced a mechanism that allowed the visible neighborhood to expand one connection at a time. This let people begin with a structured view, then shape it as their task evolved.
Key Refinements
Testing showed that tightly constrained views worked well initially, but created friction as soon as someone needed to move just beyond what was shown. Users found themselves switching modes repeatedly, which slowed them down and broke their flow. We reframed focused views as orientation tools rather than fixed containers. From there, users could expand their working area incrementally and continue editing without resetting context.
This shift changed the rhythm of work. Instead of jumping across the graph to verify each step, users stayed in one place, refined what they could see, and completed multiple edits in sequence.
Using Spotlight view to shift context along a thread
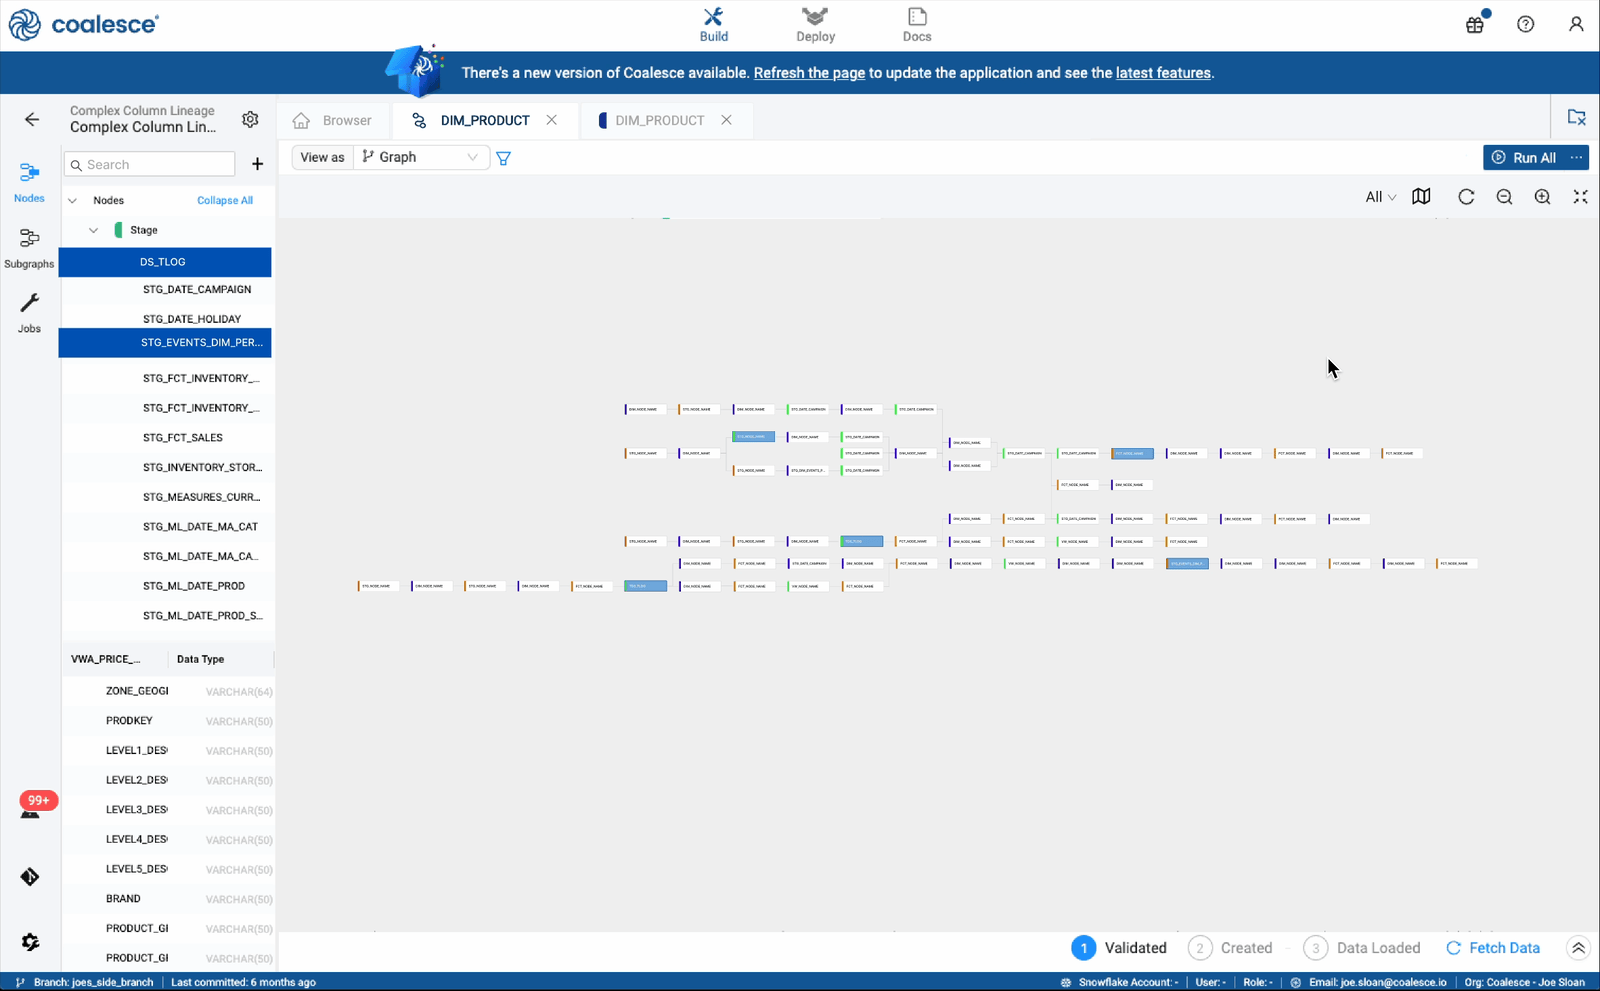
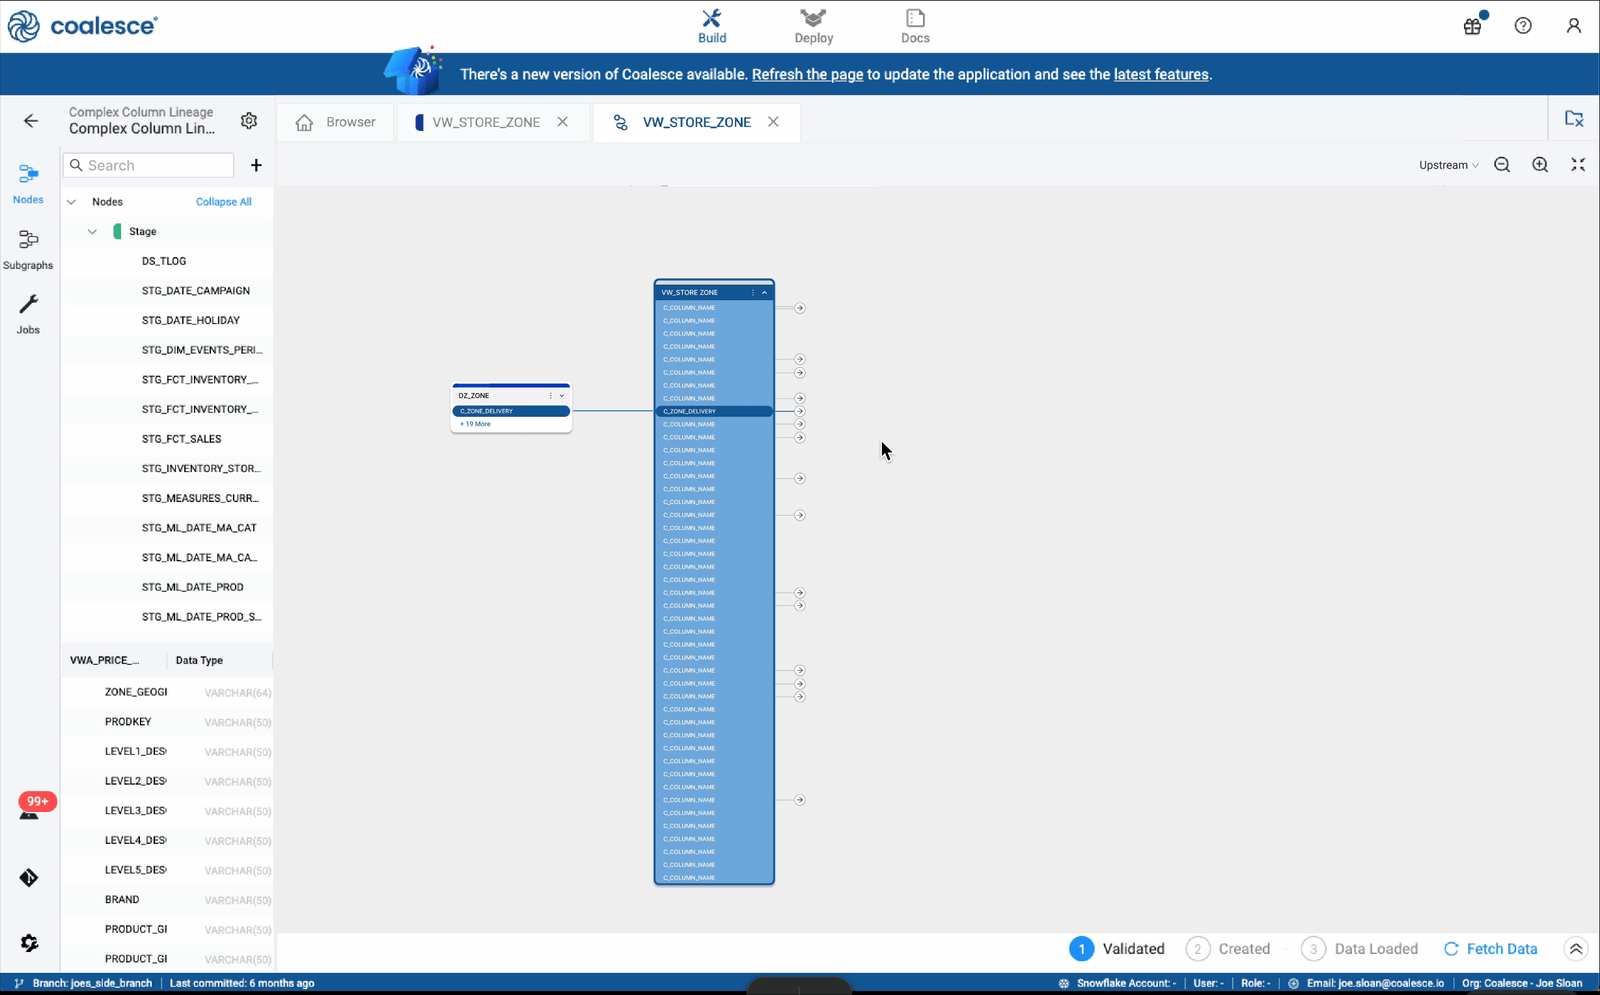
Column-level relationships introduced situations where connections became visually dense no matter what was hidden. Rather than simplify at the expense of accuracy, we exposed deeper relationships only when a user chose to inspect them.
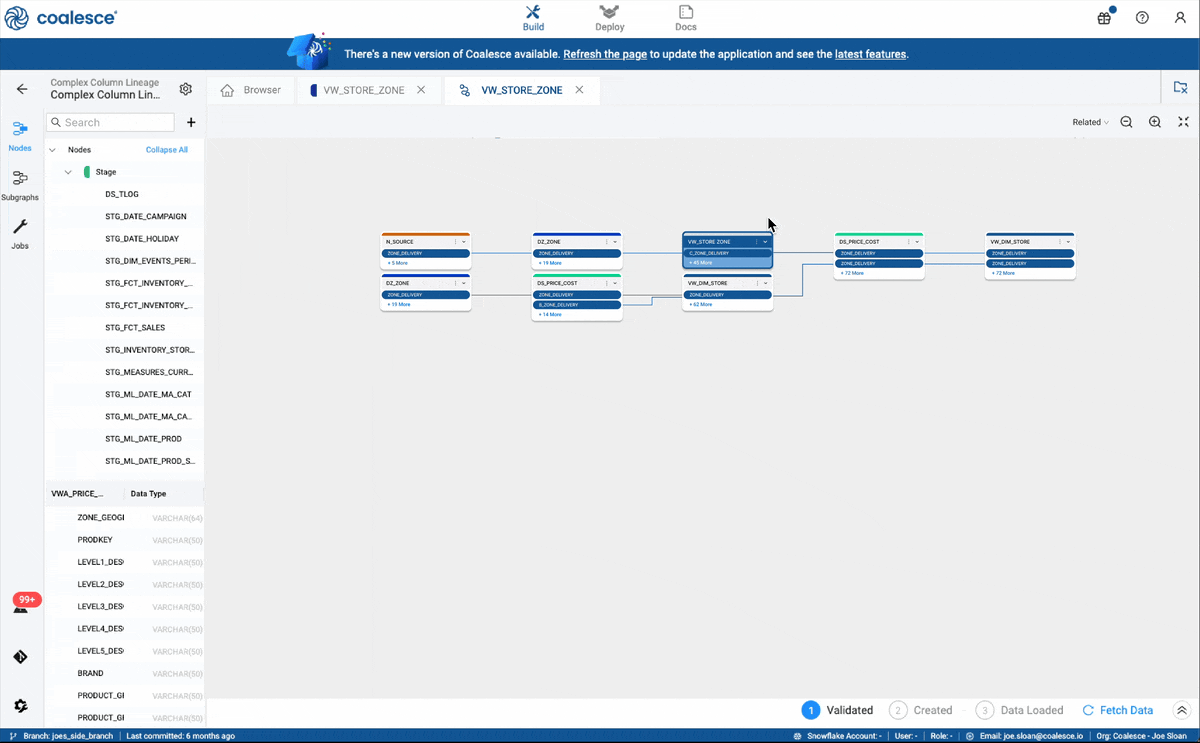
Expanding and collapsing nodes with related columns
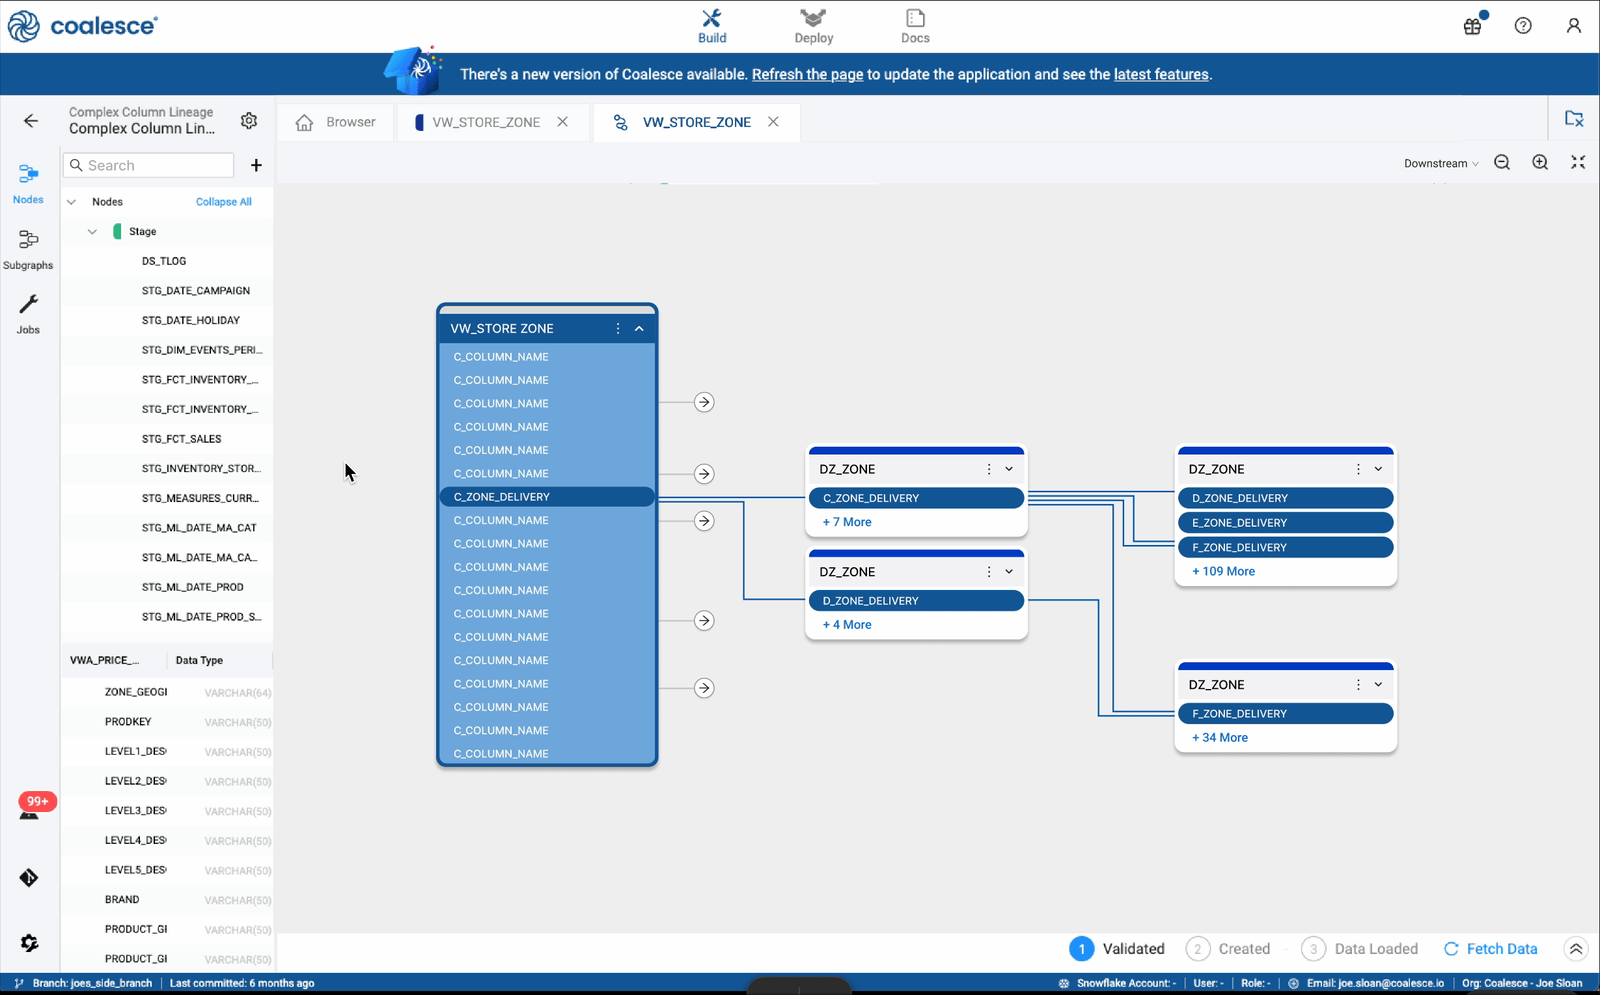
Shifting context between related columns
Expanding a lineage with arrows
Users also quickly adopted multi-select workflows, allowing them to inspect or modify related groups of nodes within the same focused context.